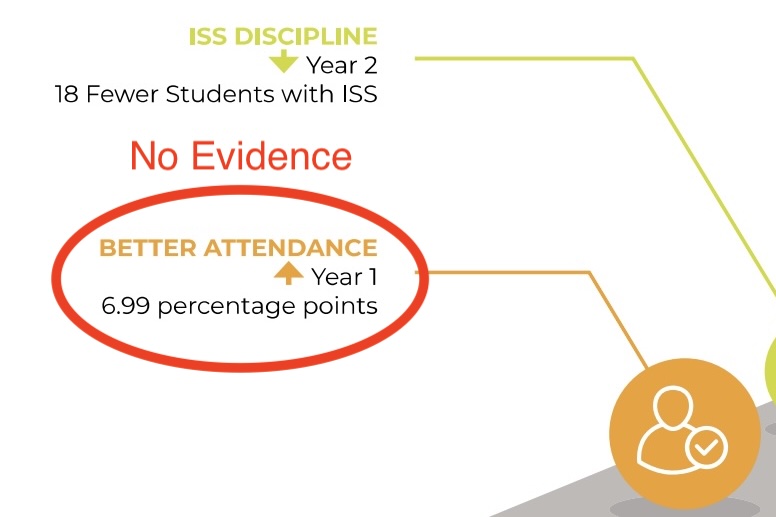
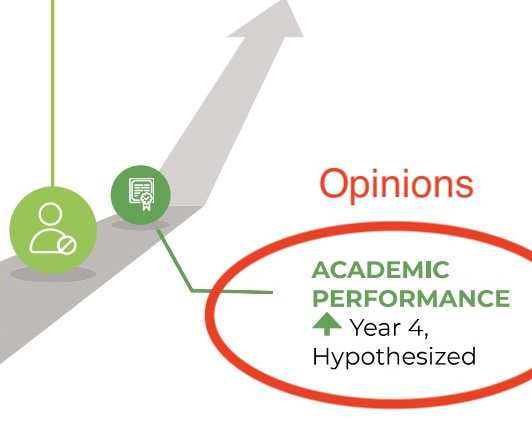
Lifewise Academy commissioned a study in 2023 that examined the 2017-2022 school years and compared schools with Lifewise to other schools nationwide. Lifewise was in approximately 120 schools in Ohio at that time. The study claims attendance rates improve by 7% when Lifewise is offered in a school, in-school and out-of-school suspensions drop, and academic performance improves. All of these claims are easily proven wrong. Data from the Ohio Department of Education and Workforce (ODEW) data dashboards do not show a change in attendance improvement rates for schools where Lifewise is offered, compared to other schools in the state. The in-school and out-of-school suspension data is also not a valid study because Ohio passed legislation to stop out-of-school suspensions for anything except violent behaviors. This dropped out-of-school suspensions from 39,000 in 2018 to 12,000 in 2023. The last stat Lifewise claims is that academics improve when Lifewise is offered. Lifewise has no data to support this, and the study says this is “hypothesized” after 4 years of Lifewise being offered.
For more details on the study Lifewise commissioned and how I verified that schools with and without Lifewise have the same attendance improvements across the state, read the rest of the article.


Lifewise Academy used the study to attempt to prove its released-time Bible education program improves a school's attendance rate. This study was funded by Ambassador Enterprises, a private equity firm whose non-profit arm has financially supported Lifewise Academy since its inception. This study was not commissioned by a third party and was paid for by a financial partner of Lifewise. Any comment that states otherwise is a lie. Lifewise has used this lie during testimony for state legislation, at school board meetings, in churches, and in numerous interviews with the press. Lifewise has even gone so far as to say that attendance improves significantly at schools where students are removed, resulting in higher overall instruction time, even though students are removed once a week for an hour.
Multiple organizations have refuted the study itself.
Honesty for Ohio Education RTRI Tool Kit (page 20)
Secular Education Association Study Rebuttal
Its data, methods, and lack of peer review render this study invalid. Lifewise has refused to release the data they used.
Comparing Lifewise and Non-Lifewise Schools
I compared schools during the 2023-2024 school year with those of the previous year. There were approximately 510 schools with Lifewise and 3,021 schools without.
ODEW maintains a website with statistics to allow the public to monitor the progress of Ohio’s public schools as they work towards recovering fully from COVID. This dashboard features an absenteeism section that displays a school's student absentee rate. This information is available from 2020 to 2024 and shows satisfactory attendance percentages. Overall, Ohio public schools have seen a couple of percentage points of improvement each year since 2021.
Lifewise claims its program will immediately increase school attendance. To validate this, I checked every school that Lifewise offered a program in during 2024 and checked the attendance from the previous year to the current year. Schools where Lifewise offered its program showed a “satisfactory” attendance rate improvement of 2.15%. Schools that did not have Lifewise showed a “satisfactory” attendance rate improvement of 2.13%. There was no statistical change in the attendance rate.
When looking at overall attendance rates and chronic absentee rates, the data were very similar. The average attendance rate increased from 2023 to 2024 in schools where Lifewise was offered by 0.59%. In schools where Lifewise was not offered, the average attendance rate increased by 0.67%. The chronic absentee rate was almost exactly the same. It improved by 1.02% for Lifewise schools and 0.99% for non-Lifewise schools.
Lifewise removes students from instructional periods in 45% of the school districts it operates in, for up to an hour a week, and there is no statistical evidence to suggest that it improves attendance in any way.
Schools Offered Lifewise
Satisfactory Attendance Change: +2.15%
Average Attendance Change: +0.55%
Chronic Absence Change: -1.03%
Schools NOT Offered Lifewise
Satisfactory Attendance Change +2.13
Average Attendance Change: +0.67%
Chronic Absence Change: -0.99%
There is no proof that Lifewise improves attendance in any meaningful way.
Details On How The Data Was Gathered
The website https://reports.education.ohio.gov/report/report-card-data-school-dashboard has absenteeism data available. The website https://reports.education.ohio.gov/report/report-card-data-school-attendance-rate-with-student-disagg contains attendance rates and chronic absentee rates. You can filter this based on the school. The Respect Public Schools website aggregates the schools where Lifewise offers classes. Having the list of schools, I could extract the data from the ODEW dashboard. The dashboard displays absenteeism data categorized into four levels: satisfactory, at-risk, moderate, and severe.
High schools were not used for this because Lifewise operates primarily at the elementary grade level. Gathering the data from 2023 and 2024, then calculating the percentage of change, and averaging them, will show how schools where Lifewise operates compare to those where Lifewise does not.
A CSV file containing all the data to verify the claims is available at https://respectpublicschools.com/docs/lw-absent-data.csv The column labeled “LW Start Date” is the date the program started or began enrolling students. If the date is empty, Lifewise was not active during 2024.
